

Digital Asset Analytics: Metrics, Dashboards, and On-Chain Data Insights
 Suyash Raizada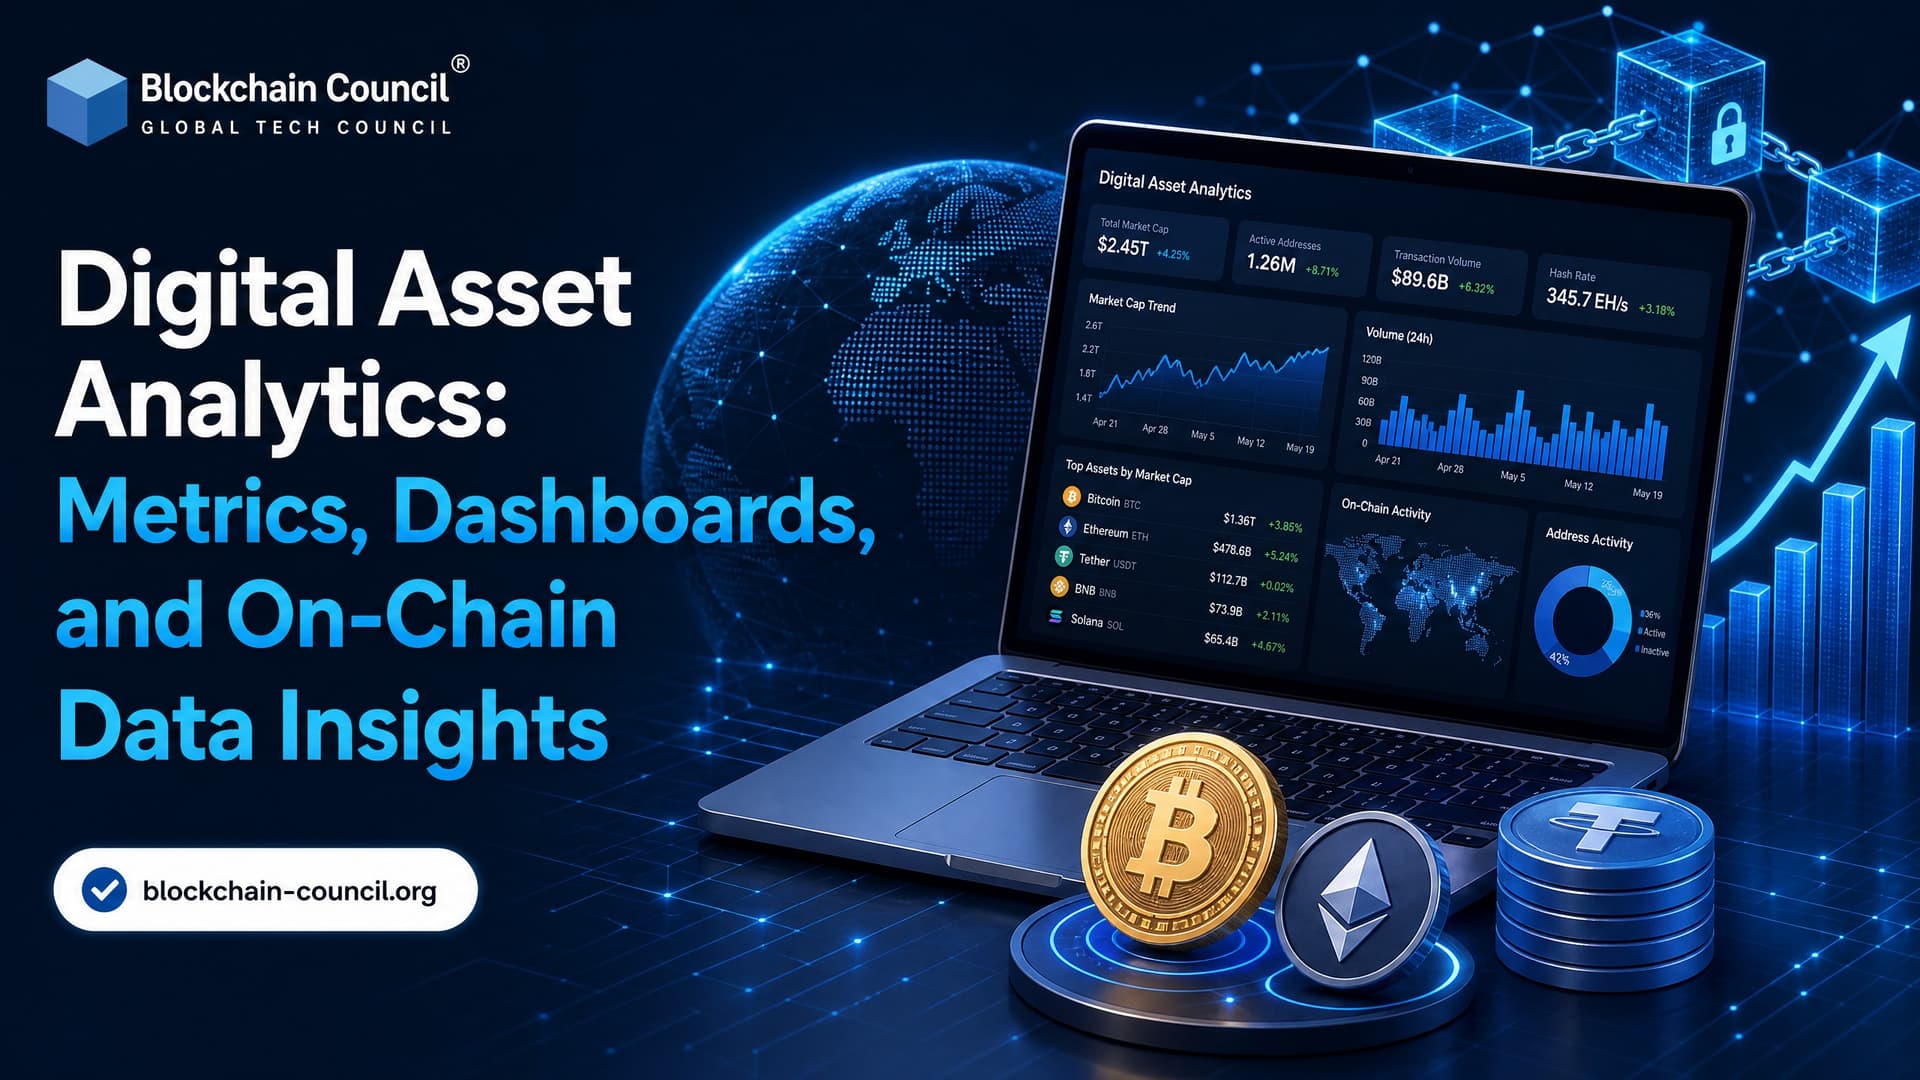
Digital asset analytics is now a core skill for anyone working with crypto markets, DeFi risk, token research, Web3 products, or compliance. Price charts still matter, but they are only one layer. The better question is this: what do the ledger, liquidity, user behavior, and protocol activity say before the market reacts?
That shift is why professional teams now combine market data, on-chain data, entity attribution, risk scoring, and dashboards. CoinDesk Data, Glassnode, Amberdata, Talos, Coin Metrics, Scorechain, DeFiLlama, DappRadar, and DeepDAO each solve a different part of the same problem: turning noisy blockchain activity into decisions you can defend.

As organizations increasingly rely on blockchain intelligence for trading, compliance, and operational decision-making, professionals need expertise that extends beyond market trends alone. A Certified Digital Assets Expert credential helps build a solid understanding of digital asset ecosystems, governance, tokenization, compliance, and institutional adoption, creating a strong foundation for advanced analytics.
What Is Digital Asset Analytics?
Digital asset analytics is the practice of collecting, cleaning, analyzing, and visualizing data from crypto markets and blockchains. It supports trading, portfolio management, compliance, treasury decisions, protocol monitoring, and Web3 strategy.
In practice, you are usually working with four data layers:
Market data: prices, volumes, order books, spreads, volatility, derivatives, and reference rates.
On-chain data: transactions, addresses, wallet balances, token transfers, smart contract events, fees, and block-level activity.
Contextual intelligence: entity labels, sanctions data, VASP directories, risk typologies, and behavioral patterns.
Dashboards and alerts: visual systems that help you track KPIs, spot changes, and report findings.
Do not treat these layers as interchangeable. A token can look liquid on a chart while most of its supply sits in a few wallets. A DeFi protocol can show rising total value locked while user activity stays flat. A wallet can look harmless until multi-hop tracing links it to a sanctioned service. That is the work.
Why On-Chain Data Has Become a Primary Intelligence Layer
Blockchains publish raw activity in near real time. That gives analysts something rare in finance: direct visibility into settlement, token movement, contract interaction, and network fees. But raw data is not insight.
CoinDesk's on-chain data product, for example, covers thousands of assets across multiple blockchains with block-by-block metrics and trade data. Scorechain describes blockchain analytics as the foundation for AML compliance, transaction monitoring, sanctions screening, source-of-funds checks, and investigations. These are not casual charting use cases. They sit inside risk committees, compliance reviews, and institutional trading workflows.
There is a beginner trap here. Counting active addresses on Bitcoin and Ethereum as if they mean the same thing can mislead you. Bitcoin uses a UTXO model, where change addresses can inflate address activity. Ethereum uses an account model, where contract interactions and externally owned accounts behave differently. If your dashboard ignores that, your metric can look precise and still be wrong.
Interpreting blockchain data accurately also requires a solid understanding of how distributed ledger networks operate. A Certified Blockchain Expert credential helps professionals strengthen their knowledge of blockchain architecture, consensus mechanisms, smart contracts, token standards, and enterprise blockchain systems, making analytical insights more reliable and actionable.
Core Digital Asset Analytics Metrics
1. Market and Trading Metrics
Market metrics help you understand price formation and execution risk. Common examples:
Spot price and returns: current price, daily returns, log returns, drawdowns, and trend strength.
Realized and implied volatility: useful for options pricing, hedging, and risk limits.
Liquidity: traded volume, order book depth, bid-ask spread, slippage, and market impact.
Derivatives: open interest, funding rates, basis, put-call ratios, skew, and term structure.
Cross-asset relationships: correlations with BTC, ETH, equities, commodities, FX, and stablecoin flows.
Talos integrates Coin Metrics data, reference rates, and indexes into institutional workflows for research, execution, risk management, and operations. That matters because analytics is most useful when it connects to the action layer, not when it sits trapped in a static report.
2. On-Chain Activity and Network Health
On-chain metrics help you judge whether a network is being used, how value moves, and where risk may be building.
Transaction counts and volumes: activity per block, per asset, or per chain.
Active and new addresses: proxy metrics for user activity, with model-specific caveats.
Fees and revenue: useful for judging demand for blockspace and protocol economics.
Exchange flows: deposits and withdrawals that may signal liquidity or sell-side pressure.
Holder behavior: accumulation, distribution, long-term holder spending, and profitability.
Entity exposure: funds moving between wallets, exchanges, bridges, mixers, DeFi contracts, or high-risk services.
Glassnode research often combines on-chain profitability, long-term holder behavior, derivatives positioning, and ETF flows to explain Bitcoin market phases. That is the right approach. A single metric rarely tells the truth. A cluster of metrics can.
3. DeFi and Protocol Metrics
DeFi dashboards answer a different question: is the protocol healthy, sustainable, and actively used?
Total value locked: capital deposited in a protocol or chain.
Liquidity distribution: where capital sits across pools, markets, and collateral types.
Borrowing and lending activity: utilization, rates, collateral ratios, and liquidation levels.
Protocol revenue: fees paid by users and the share captured by token holders or treasuries.
User retention: repeat wallets, cohort activity, and transaction frequency.
Governance: proposal count, voter participation, treasury movement, and delegate behavior.
DeFiLlama is widely used for TVL and protocol rankings. Crypto Fees tracks fees generated by blockchains and crypto organizations. DeepDAO and Tally help track DAO governance participation. None of these tools is perfect, but together they help you separate real usage from marketing noise.
4. Tokenomics, Supply, and Unlock Metrics
Supply data can change your whole view of a token. You need to know who holds supply, when locked tokens enter circulation, and whether exchange balances are rising.
Top holder concentration: a high share in a few wallets creates governance and market risk.
Vesting schedules: investor, team, ecosystem, and foundation unlock timelines.
Circulating versus fully diluted value: important for valuation comparisons.
Exchange reserves: tokens held on exchanges versus self-custody or staking contracts.
Treasury transparency: public wallets controlled by foundations, DAOs, or protocols.
Token Unlocks is a useful reference here. If you are preparing investment research, do not skip unlock calendars. A clean chart can break quickly when a large cliff unlock meets thin liquidity.
How to Build Useful Digital Asset Dashboards
A good dashboard is not a wall of charts. It is a decision tool. Start with the user and the decision they need to make.
Step 1: Define the Decision
Ask what the dashboard should answer. Examples:
Should we increase or reduce exposure to an asset?
Is a protocol showing signs of liquidity stress?
Are incoming customer funds linked to high-risk entities?
Is governance controlled by a small voter group?
Are token unlocks likely to pressure market liquidity?
Step 2: Choose KPIs Carefully
Keep the first version small. For a BTC market dashboard, you might track spot price, realized volatility, exchange netflows, long-term holder spending, funding rates, and ETF flow data where available. For a DeFi lending dashboard, you might track TVL, utilization, collateral ratios, liquidation zones, oracle health, and top wallet exposure.
To be blunt, most teams overbuild dashboards. Ten reliable metrics beat fifty untested widgets.
Step 3: Check Data Quality
Crypto markets run 24/7, and data cleaning is not optional. Watch for duplicate trades, stale prices, chain reorganizations, missing blocks, token decimal mistakes, and mislabeled contracts.
Here is one small but painful example. When you query Ethereum logs through JSON-RPC, large block ranges may fail or time out depending on the provider. Split requests by block range and keep a finality buffer instead of assuming the latest block is safe for accounting. If you have ever rebuilt a pipeline after an indexing gap, you remember it.
Step 4: Add Alerts and Reporting
Dashboards should trigger action. Add alerts for:
Large exchange inflows or outflows
Rapid liquidity withdrawal from pools
Sharp funding rate changes
Unusual bridge activity
Wallet exposure to sanctioned or high-risk entities
Token unlock events
Governance proposal changes
The core principle is simple: define KPIs, configure dashboards, integrate your tools, automate reports, and turn visualizations into decisions.
Building effective digital asset analytics platforms often requires expertise in cloud infrastructure, APIs, cybersecurity, automation, enterprise integrations, analytics, and AI-enabled workflows. A Tech Certification complements blockchain knowledge by strengthening these broader technical capabilities, enabling professionals to design scalable and secure analytics solutions.
Use Cases Across Trading, Compliance, and Web3
Trading and Portfolio Management
Trading teams use digital asset analytics to combine price, liquidity, derivatives, on-chain flows, and holder behavior. Glassnode's market intelligence is often used to study phases such as accumulation, consolidation, and distribution. Amberdata focuses on institutional digital asset metrics across asset classes. CoinDesk Data publishes market research and data products aimed at professional users.
The trade-off is simple. Free dashboards are useful for exploration, but serious execution and risk systems need APIs, historical depth, clean identifiers, uptime guarantees, and documentation.
Compliance and AML
Compliance teams use blockchain analytics for transaction monitoring, sanctions screening, source-of-funds verification, and investigations. Scorechain highlights entity attribution, clustering, risk scoring, multi-hop tracing, and audit-ready reporting as key capabilities.
This is where block explorers fall short. A block explorer can show a transaction. A compliance platform can show exposure, labels, risk context, and the path of funds through services and chains.
DeFi, NFT, and DAO Monitoring
Builders and analysts use DeFiLlama for protocol TVL, DappRadar for application activity, DeepDAO and Tally for governance, and Crypto Fees for fee generation. NFT analysts usually add floor price, volume, holder distribution, wash trading signals, and listing depth.
If you are evaluating a Web3 product, usage quality matters more than vanity counts. A thousand wallets farming an airdrop is not the same as a thousand paying users.
Skills Professionals Need Next
Digital asset analytics sits between data science, blockchain fundamentals, market structure, and compliance. You do not need to master everything at once, but you should build a working stack.
Learn blockchain data models, including UTXO, account-based chains, logs, events, and token standards such as ERC-20 and ERC-721.
Practice SQL on indexed blockchain datasets and learn how dashboards are built.
Understand DeFi mechanics: AMMs, lending markets, liquidations, oracle risk, and bridges.
Study market microstructure: spreads, slippage, funding, open interest, and volatility.
Learn compliance concepts such as AML, sanctions screening, VASPs, source of funds, and risk scoring.
Use APIs from data providers once spreadsheet exports stop being enough.
For structured learning, look at Blockchain Council programs such as Certified Blockchain Expert™, Certified Cryptocurrency Expert™, Certified DeFi Expert™, Certified Blockchain Developer™, and Certified Web3 Expert™. If your role leans toward automated reporting or anomaly detection, pair blockchain knowledge with AI training such as the Certified Artificial Intelligence (AI) Expert™.
Future of Digital Asset Analytics
The next phase will be more integrated and more demanding. Institutions will expect analytics inside trading, custody, treasury, and compliance systems. Cross-chain support will expand across Layer 2s, app-chains, rollups, and bridges. Regulatory pressure will push more teams toward real-time monitoring and audit-ready reports.
AI will also play a larger role, especially in anomaly detection, entity clustering, automated reporting, and narrative summaries. Be careful, though. AI-generated explanations are only as good as the underlying labels and data pipeline. If the input is wrong, the summary will sound confident and still fail a review.
Your next step is practical. Pick one asset or protocol, build a dashboard with five metrics, document the data source for each metric, and write the decision rule. If you can explain why each chart matters, you are no longer just looking at data. You are doing digital asset analytics.
Technical insights become even more valuable when they can be communicated clearly to executives, investors, clients, and other stakeholders. A Marketing Certification helps professionals strengthen strategic communication, data storytelling, and stakeholder engagement skills, making complex digital asset analytics easier to translate into informed business decisions.
FAQs
1. What is digital asset analytics?
Digital asset analytics is the process of collecting, analyzing, and interpreting blockchain and market data to understand the performance, activity, and health of digital assets and blockchain networks. It combines on-chain data, market indicators, and operational metrics to support informed decision-making.
2. What is on-chain data?
On-chain data refers to information permanently recorded on a blockchain, including transactions, wallet addresses, smart contract interactions, token transfers, staking activity, and network participation. Because this data is publicly verifiable on many blockchain networks, it provides valuable insights into network behavior and adoption.
3. Why is digital asset analytics important?
Analytics helps investors, enterprises, developers, regulators, and researchers monitor blockchain activity, evaluate network performance, detect anomalies, assess adoption trends, and improve operational decision-making. Reliable analytics also supports transparency and risk management.
4. What metrics are commonly tracked in digital asset analytics?
Common metrics include transaction volume, active wallet addresses, transaction fees, block production, staking participation, token supply, total value locked (TVL), liquidity, trading volume, validator activity, smart contract usage, and network growth. The most relevant metrics depend on the blockchain and use case.
5. What are blockchain analytics dashboards?
Blockchain analytics dashboards are visual platforms that present key performance indicators (KPIs), charts, and reports related to blockchain activity. Dashboards help users monitor network health, asset performance, transaction trends, wallet activity, and operational metrics in real time or over historical periods.
6. How is on-chain analytics different from market analysis?
On-chain analytics focuses on blockchain activity recorded directly on distributed ledgers, while market analysis emphasizes price movements, trading volume, technical indicators, and broader financial market behavior. Many analysts combine both approaches for a more comprehensive perspective.
7. What is Total Value Locked (TVL)?
Total Value Locked (TVL) measures the value of assets deposited in decentralized finance (DeFi) protocols such as lending platforms, decentralized exchanges, and liquidity pools. TVL is commonly used as one indicator of protocol activity, although it should be interpreted alongside other metrics.
8. How do active wallet addresses provide insights?
The number of active wallet addresses can indicate user participation and network activity over a given period. However, wallet counts do not necessarily represent unique individuals because one user may control multiple addresses.
9. Why are transaction volumes important?
Transaction volume helps measure the level of activity occurring on a blockchain network. Consistent transaction growth may indicate increased usage, while sudden changes should be analyzed alongside other technical and market factors rather than viewed in isolation.
10. What role do smart contract analytics play?
Smart contract analytics monitor contract interactions, usage frequency, gas consumption, security events, and operational performance. These insights help developers optimize applications and assist organizations in evaluating decentralized applications (dApps) and protocol adoption.
11. How are dashboards used by enterprises?
Enterprises use blockchain dashboards to monitor operational performance, track tokenized assets, oversee supply chain activities, manage compliance reporting, evaluate blockchain integrations, and support executive decision-making through centralized reporting.
12. How does AI improve digital asset analytics?
Artificial intelligence can automate data processing, detect unusual transaction patterns, identify potential fraud, forecast operational trends, classify blockchain activity, generate reports, and assist with predictive analytics. AI-generated insights should be validated using reliable data sources and appropriate human oversight.
13. What are common blockchain analytics use cases?
Use cases include fraud detection, compliance monitoring, anti-money laundering (AML), transaction investigations, decentralized finance (DeFi) analysis, token performance evaluation, enterprise reporting, network health monitoring, cybersecurity, and investment research.
14. How do organizations maintain data quality?
Organizations improve data quality by validating multiple data sources, maintaining standardized reporting methods, performing regular audits, documenting data lineage, and implementing governance policies for data collection, storage, and analysis.
15. What security considerations apply to digital asset analytics?
Security measures include protecting sensitive data, controlling access to analytics platforms, encrypting information, monitoring system activity, validating data integrity, securing APIs, and implementing cybersecurity best practices throughout the analytics infrastructure.
16. What regulatory considerations affect blockchain analytics?
Organizations should consider applicable privacy laws, anti-money laundering (AML) requirements, know-your-customer (KYC) obligations, financial reporting standards, sanctions compliance, data governance policies, and industry-specific regulations. Compliance responsibilities vary across jurisdictions and business sectors.
17. What challenges exist in digital asset analytics?
Challenges include interpreting large volumes of blockchain data, distinguishing meaningful signals from noise, integrating multiple blockchain networks, maintaining data accuracy, adapting to changing protocols, ensuring interoperability, and addressing evolving regulatory expectations.
18. What trends are shaping digital asset analytics in 2026?
Key trends include AI-powered blockchain intelligence, real-time enterprise dashboards, cross-chain analytics, tokenized real-world asset (RWA) monitoring, decentralized identity analytics, predictive risk modeling, automated compliance reporting, and enhanced blockchain visualization tools.
19. How can beginners learn digital asset analytics?
Beginners should study blockchain fundamentals, learn how blockchain explorers work, understand common on-chain metrics, explore analytics dashboards, practice interpreting network data, and stay informed through official documentation, reputable research publications, and educational resources.
20. What is the future of digital asset analytics?
Digital asset analytics is expected to become increasingly sophisticated as blockchain adoption expands across finance, supply chains, healthcare, government, and enterprise technology. AI-assisted analytics, standardized reporting frameworks, improved interoperability, and stronger governance are likely to enhance the quality and usefulness of blockchain insights while supporting more informed operational and investment decisions. The blockchain may record every transaction forever, but turning all that data into actual wisdom still requires more than a very colorful dashboard.
Related Articles
View All
Digital Assets
What Is On-Chain Asset Ownership in RWA Tokenization?
On-chain asset ownership records tokenized claims to real-world assets on blockchain while legal title remains tied to custody and contracts.

Digital Assets
How Asset Tokenization Creates Verifiable Digital Ownership
Asset tokenization turns rights to real world and financial assets into blockchain tokens, giving authorized parties a verifiable record of ownership, provenance, and compliance.

Digital Assets
CBDC and Real-World Asset Tokenization: Enabling Digital Securities and RWAs
CBDCs and real-world asset tokenization are converging to support digital securities, tokenized bonds, treasuries, and regulated on-chain settlement.
Trending Articles
The Role of Blockchain in Ethical AI Development
How blockchain technology is being used to promote transparency and accountability in artificial intelligence systems.
How Blockchain Secures AI Data
Understand how blockchain technology is being applied to protect the integrity and security of AI training data.
Claude AI Tools for Productivity
Discover Claude AI tools for productivity to streamline tasks, manage workflows, and improve efficiency.