

AI Agent Monitoring and Observability: Tools, Metrics, and Strategies
 Suyash Raizada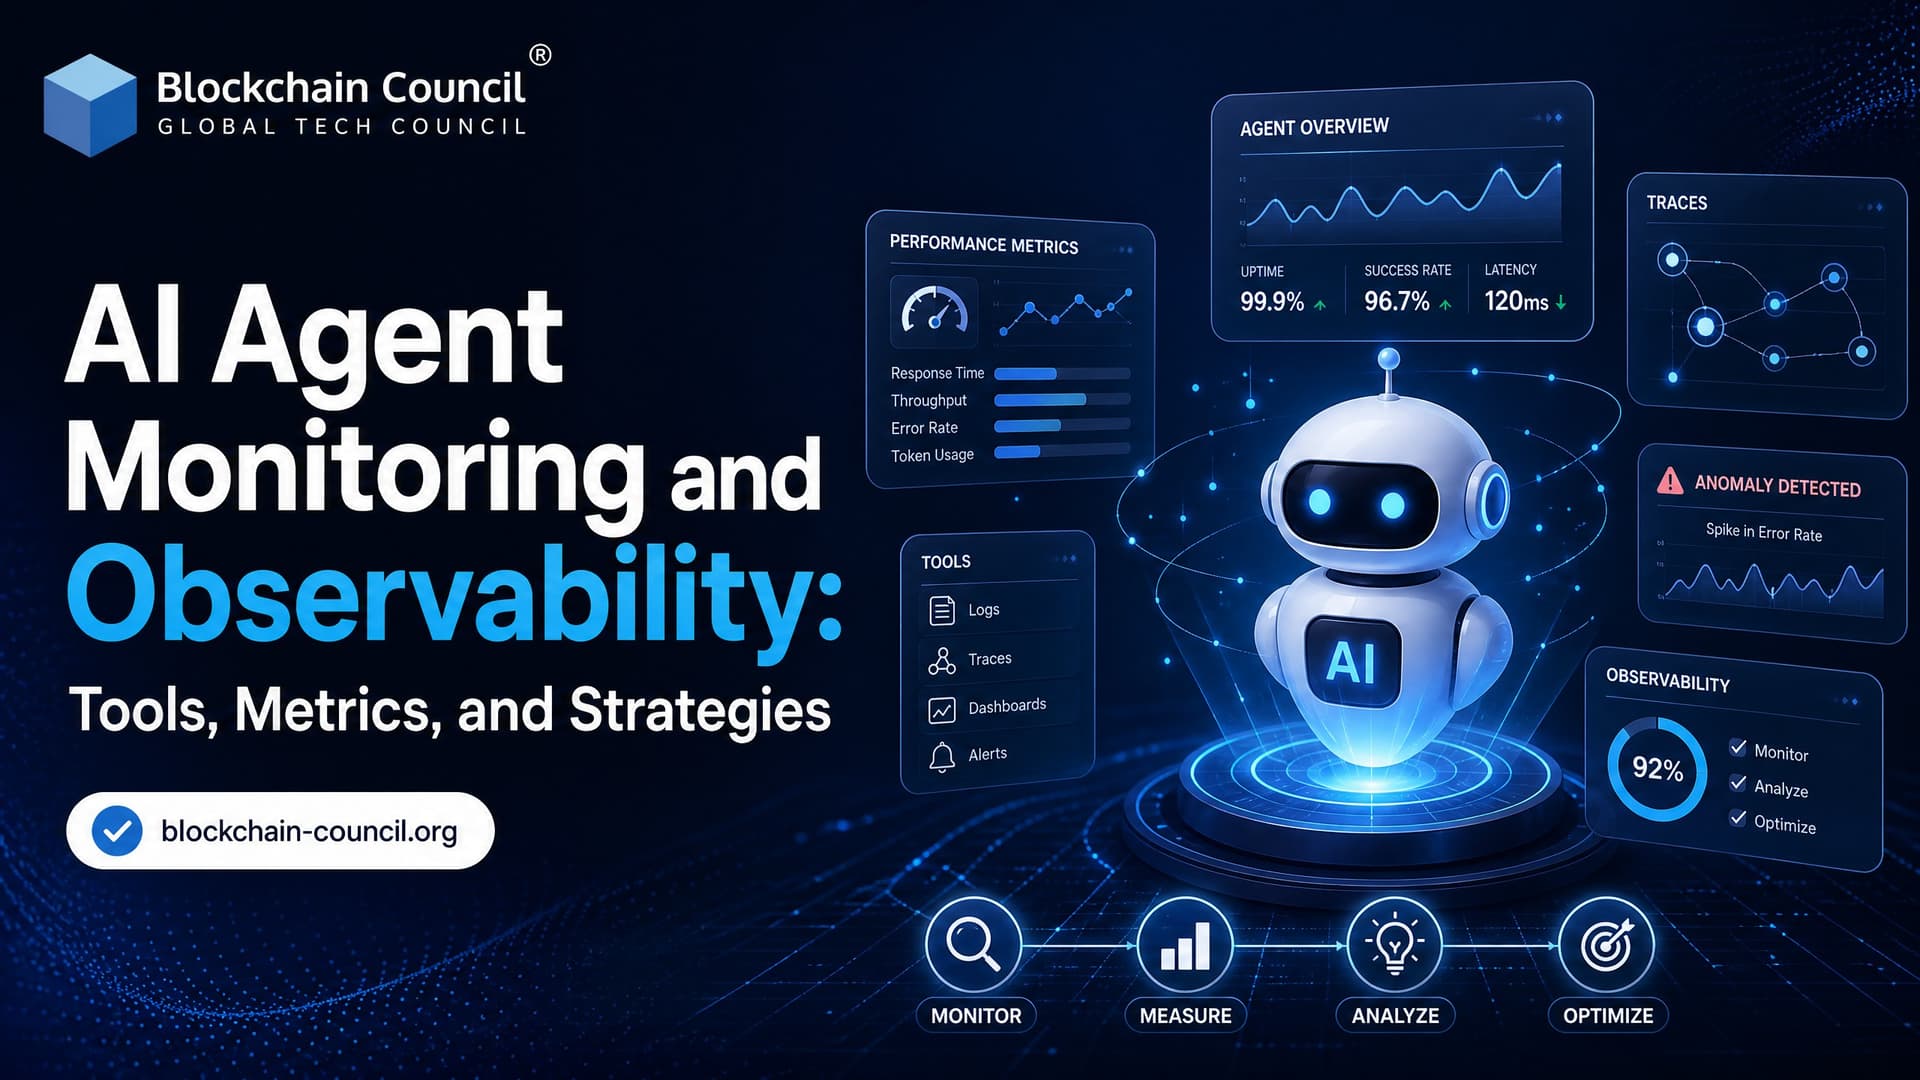
AI agent monitoring and observability is how you keep autonomous systems explainable after they leave the demo environment. A chatbot response is one thing. An agent that retrieves data, calls tools, writes code, updates records, and hands work to another agent is a different operational problem.
If you are putting agents into production, you need more than uptime checks and token counts. You need traces of decisions, tool calls, prompt versions, retrieved context, policy checks, failures, and human approvals. Without that, your team is guessing.

As enterprises deploy AI agents across engineering, security, and operations teams, professionals with a Certified Scrum Master Expert™ background often help coordinate cross-functional implementation, establish iterative monitoring processes, and ensure observability practices evolve alongside production AI systems.
What AI Agent Observability Actually Means
AI agent observability extends traditional logs, metrics, and traces into the internal behavior of agentic systems. It helps you see how an agent moved from input to action, which tools it used, what data it retrieved, where it failed, and whether it stayed inside policy.
IBM describes agent observability using MELT data: metrics, events, logs, and traces. For agents, that telemetry must also include AI-specific signals such as tool selection, reasoning steps, resource use, and interactions between agents.
Three ideas matter most:
Visibility: capture prompts, model responses, tool calls, outputs, errors, and permission context.
Traceability: follow a task across multi-step workflows, external APIs, vector databases, and downstream systems.
Accountability: answer who invoked the agent, what it accessed, why it acted, and what changed afterward.
One caution from real deployments: do not treat raw chain-of-thought logging as the default answer. In many systems, you should store action rationales, tool inputs and outputs, prompt versions, evaluator scores, and decision summaries instead. That gives auditors and engineers useful evidence without exposing sensitive internal reasoning text unnecessarily.
Why Agent Monitoring Is Different From LLM Monitoring
Classic LLM monitoring is usually built around request-response behavior. A user sends a prompt. A model returns an answer. You measure latency, cost, error rate, and maybe hallucination risk.
Agents do not behave that neatly.
An agent may call a search tool, inspect a database result, retry with a different query, ask another agent for help, write to a CRM, and then produce a final answer. If the result is wrong, the failure may sit in the retrieval step, the tool schema, the prompt, the access policy, or the model configuration.
This is why Salesforce and other enterprise AI teams now emphasize reasoning steps, tool selection, retrieval context, and prompt management. The output is only the last frame of the movie.
Building reliable monitoring pipelines for agentic systems requires expertise in orchestration, evaluation, and governance. Many AI engineers and enterprise architects strengthen these practical skills through a Certified Agentic AI Expert™ program before deploying large-scale autonomous workflows.
Core Metrics for AI Agent Monitoring and Observability
Reliability and Performance Metrics
Start with the operational basics, but tie them to agent runs rather than isolated API calls.
Task success rate: percentage of workflows completed correctly, based on automated checks or human review.
Error rate by tool: failed API calls, invalid tool arguments, schema mismatches, permission errors, and timeouts.
Latency and time-to-action: how long the agent takes before a critical decision or external action.
Iteration count: number of reasoning or tool-use loops before completion.
Token and API cost: usage by agent, workflow, model, customer, or environment.
Resource usage: CPU, memory, queue depth, and external service consumption.
A small detail that bites teams: temperature changes can quietly alter agent behavior. I have seen an agent pass staging at temperature 0 and start making unstable tool choices at 0.7. Log temperature, top_p, model name, prompt version, and tool list for every run.
Quality, Safety, and Hallucination Metrics
For RAG and tool-heavy agents, track whether the agent is grounded in the right evidence.
Groundedness: whether the answer is supported by retrieved documents or tool outputs.
Retrieval relevance: whether the vector search returned useful context for the task.
Hallucinated tool calls: attempts to call tools that do not exist or are not allowed.
Policy violation rate: unsafe actions, disallowed data access, or non-compliant recommendations.
Human override rate: how often reviewers stop, edit, or reverse agent actions.
In LangChain-style ReAct agents, a common failure looks like this: Tool calculator_v2 is not a valid tool, try one of [calculator, search]. That single line tells you the model invented a tool name, the prompt exposed naming confusion, or the available tool list changed without a matching prompt update.
Governance and Compliance Metrics
For regulated teams, observability must also support audit work.
Identity and access: user, agent identity, role, permission scope, and data accessed.
Policy enforcement: whether guardrails blocked or allowed specific actions.
Shadow AI detection: unsanctioned agents running across SaaS tools, endpoints, or custom apps.
Change traceability: prompt, model, tool, and data-source versions tied to each decision.
Retention and audit exports: stored telemetry that compliance teams can inspect later.
Zenity frames this as a security issue, not just an engineering issue. That view is right. An unmonitored agent with SaaS permissions can become a data exposure path before anyone notices it.
Tool Landscape: What to Use and When
No single platform is best for every agentic workload. Pick based on your stack, risk profile, and where debugging pain shows up.
LangSmith
LangSmith is a strong fit if your team builds with LangChain or LangGraph and needs traces, evaluations, datasets, and human review workflows. It is useful when domain experts need to annotate real production traces instead of reading raw logs.
Langfuse
Langfuse is open source and self-hostable. It works well for teams that want prompt management, tracing, and evaluations without sending all observability data to a managed SaaS vendor. It is a practical starting point for early agent prototypes.
Arize Phoenix and AX
Arize Phoenix is often a good choice when OpenTelemetry portability and self-hosting matter. Use it when you need visibility into LLM, RAG, and agent traces while keeping tighter control over data residency.
Datadog LLM Observability
If your production services already run on Datadog APM, Datadog LLM Observability is usually the lowest-friction option. The benefit is correlation: you can connect agent behavior to infrastructure, application traces, logs, and service incidents.
AgentOps
AgentOps focuses on autonomous agents and multi-agent frameworks such as CrewAI. It is useful when your issue is not a single bad answer, but recursive loops, multi-step reasoning chains, and handoffs between agents.
Braintrust, Galileo, Portkey, and Zenity
Braintrust: useful for developer teams that want evaluations and observability close to coding workflows.
Galileo: strong for hallucination detection, RAG quality, and AI safety analysis.
Portkey: helpful when provider routing, fallbacks, and reliability across model vendors are priorities.
Zenity: aimed at enterprise discovery, shadow AI, SaaS agent risk, and governance.
To be blunt, do not choose a tool because a demo trace looks pretty. Test it against a messy workflow: failed retrieval, bad tool arguments, retries, human approval, and downstream API errors. Production agents fail in boring places.
A Practical Monitoring Strategy for Production Agents
1. Instrument From the First Prototype
Add tracing before the agent becomes complicated. Capture input, prompt version, model, parameters, tool list, tool calls, outputs, errors, user identity, and final result. Retrofitting this later is painful.
2. Use Structured Logs
Free-text logs are hard to query. Use JSON-style schemas for agent_run_id, session_id, model, prompt_version, tool_name, tool_args, status, latency_ms, token_count, and policy_result. Keep naming consistent across services.
3. Connect Agent Traces to OpenTelemetry
Where possible, connect agent traces with OpenTelemetry so your AI workflow is visible beside standard application telemetry. This matters when a slow agent is actually waiting on a vector database, a payment API, or a permissions service.
4. Version Prompts, Tools, and Data Sources
Version everything that can change behavior. That includes system prompts, retrieval indexes, tool schemas, model providers, temperature, top_p, and guardrail rules. If error rate jumps after a prompt edit, you should know within minutes.
5. Add Evaluations Before Alerts
Bad alerts create noise. First define what good looks like. Use automated evaluations for groundedness, policy compliance, correct tool use, task completion, and refusal quality. Then alert on meaningful degradation.
6. Test Failure Modes Deliberately
Run synthetic workflows that force edge cases:
An agent repeats the same tool call until it hits an iteration limit.
A retrieved document contains stale policy text.
A tool returns a 403 permission error.
The model tries to call a missing function.
A downstream API times out after the agent has already made a partial update.
If your observability stack cannot explain these cases in staging, it will not help much during an incident.
Where Blockchain and AI Governance Meet
Teams working in blockchain, Web3, and financial systems should treat agent telemetry as governance evidence. Agent decisions may affect wallets, smart contract workflows, compliance reviews, fraud checks, or customer communications. Auditability is not optional.
This is also where Blockchain Council learning paths fit naturally. Professionals building or supervising these systems can connect this topic with Certified Agentic AI Expert™, Certified Artificial Intelligence (AI) Expert™, and Certified Prompt Engineer™. The useful path is simple: learn agent design, then learn observability, then learn governance controls for high-risk environments.
Common Mistakes to Avoid
Logging only final answers: you lose the evidence needed to debug the agent.
Ignoring tool schemas: many agent failures come from mismatched arguments, not model quality.
Using one dashboard for every audience: engineers, security teams, and compliance reviewers need different views.
Skipping access telemetry: you cannot prove safe behavior if you do not know what data the agent touched.
Assuming proof-of-concept results will scale: multi-agent behavior changes under concurrency, longer context, and real user inputs.
Next Step
Build a small monitored agent before you scale a large one. Use one retrieval source, two tools, versioned prompts, structured logs, and an observability platform such as LangSmith, Langfuse, Arize Phoenix, Datadog LLM Observability, or AgentOps. Then break it on purpose. The traces you collect from those failures will teach you more than a clean demo ever will.
While AI agent observability is primarily associated with engineering and governance, the same monitoring principles also improve customer-facing AI applications, campaign automation, and personalized digital experiences. Professionals who combine technical AI expertise with a Marketing Certification are better equipped to measure business impact while maintaining responsible AI operations.
FAQs
What Is AI Agent Monitoring?
AI agent monitoring is the continuous process of tracking an AI agent's performance, actions, resource usage, tool interactions, and outcomes to ensure it operates reliably, securely, and efficiently in production environments.
What Is AI Agent Observability?
AI agent observability is the ability to understand how and why an AI agent behaves by collecting and analyzing telemetry such as logs, metrics, traces, memory usage, reasoning steps (where appropriate), tool calls, and workflow execution data.
What Is the Difference Between Monitoring and Observability?
Monitoring focuses on detecting known issues through predefined metrics and alerts, while observability helps engineers investigate unknown problems by providing detailed insights into an AI agent's internal operations and workflow execution.
Why Is AI Agent Monitoring Important?
Monitoring helps organizations identify performance issues, detect failures, improve reliability, reduce downtime, enhance security, and maintain consistent business operations.
Which Metrics Should Businesses Monitor?
Important metrics include:
Task completion rate
Response time
Success rate
Failure rate
Latency
Token usage
API usage
Tool execution time
Cost per task
User satisfaction
What Logs Should AI Agents Generate?
Useful logs include:
User requests
Tool calls
Workflow execution
API responses
Errors
Authentication events
Security events
Human approvals
System changes
What Is Distributed Tracing in AI Agent Systems?
Distributed tracing follows a request as it moves across multiple AI agents, APIs, databases, orchestration layers, and enterprise systems, helping engineers identify delays, failures, or bottlenecks.
Why Is Workflow Observability Important?
Workflow observability helps teams understand how tasks progress through complex multi-agent systems, identify bottlenecks, improve automation, and troubleshoot failed workflows.
How Can Businesses Detect AI Agent Failures?
Organizations can detect failures using:
Real-time alerts
Health checks
Error logs
Timeout monitoring
Exception tracking
Workflow status dashboards
Performance analytics
How Does Observability Improve AI Agent Performance?
Observability provides data that helps developers optimize prompts, improve workflow design, reduce latency, enhance tool selection, and identify inefficient processes.
Can Observability Improve AI Security?
Yes. Monitoring security events, unusual tool usage, authentication attempts, prompt injection attempts, and access patterns helps identify suspicious behavior and supports incident response.
What Role Does Human-in-the-Loop Play in Monitoring?
Human reviewers can investigate flagged workflows, validate AI decisions, approve sensitive actions, and provide feedback that improves operational quality and governance.
How Does MCP Affect AI Agent Observability?
When using the Model Context Protocol (MCP), organizations should monitor MCP server availability, tool discovery, authentication events, tool execution success, latency, and resource access to maintain operational visibility.
How Does Retrieval-Augmented Generation (RAG) Impact Monitoring?
Businesses should monitor retrieval accuracy, document relevance, search latency, retrieval failures, knowledge source freshness, and response quality to ensure RAG systems provide reliable information.
Which Technologies Support AI Agent Observability?
Common technologies include:
OpenTelemetry
Grafana
Prometheus
Datadog
Elasticsearch
Kibana
Jaeger
Cloud monitoring platforms
AI observability platforms
What KPIs Measure AI Agent Performance?
Useful KPIs include:
Workflow success rate
Mean Time to Resolution (MTTR)
Task accuracy
Customer satisfaction
Automation rate
Operational cost
System uptime
Return on investment (ROI)
What Challenges Exist in AI Agent Observability?
Common challenges include:
Multi-agent complexity
Context tracking
Distributed workflows
Tool integration
Data privacy
Cost of monitoring
Large log volumes
Performance overhead
How Can Enterprises Build an Effective Observability Strategy?
Organizations should:
Define measurable KPIs
Centralize logging
Implement distributed tracing
Monitor tool usage
Automate alerts
Review workflow performance regularly
Conduct incident analysis
Continuously optimize AI systems
What Common Monitoring Mistakes Should Organizations Avoid?
Avoid monitoring only infrastructure while ignoring AI behavior, collecting excessive logs without actionable insights, failing to track tool usage, overlooking workflow failures, neglecting cost monitoring, and waiting for users to report problems instead of detecting them proactively. If the first indication of failure comes from an unhappy customer, your monitoring system has quietly resigned from its job.
What Is the Future of AI Agent Monitoring and Observability?
As AI agents become more autonomous and enterprise workflows grow more complex, observability will evolve beyond traditional infrastructure monitoring to include reasoning analysis, workflow intelligence, multi-agent tracing, security analytics, cost optimization, and governance dashboards. Organizations that invest in comprehensive monitoring, standardized telemetry, human oversight, and continuous performance evaluation will be better equipped to build reliable, secure, and scalable AI agent systems for enterprise environments.
Related Articles
View All
Agentic AI
AI Agent Harnesses, Tools & Context: The Infrastructure Behind Autonomous AI
Learn how AI agent harnesses, tools, and context work together. This beginner-friendly guide covers function calling, APIs, context engineering, memory, RAG, guardrails, and agent evaluation.

Agentic AI
AI Agent Orchestration Guide: Coordinating Tools, Tasks, and Multi-Agent Systems
A practical guide to AI agent orchestration, covering tools, task routing, shared state, governance, platforms, and multi-agent system patterns.

Agentic AI
AI Agent Performance Metrics: KPIs Every Manager Should Track
A practical KPI scorecard for AI agents covering accuracy, automation, cost, reliability, user experience, risk, learning, and business ROI with benchmarks.
Trending Articles
The Role of Blockchain in Ethical AI Development
How blockchain technology is being used to promote transparency and accountability in artificial intelligence systems.
Top 5 DeFi Platforms
Explore the leading decentralized finance platforms and what makes each one unique in the evolving DeFi landscape.
Can DeFi 2.0 Bridge the Gap Between Traditional and Decentralized Finance?
The next generation of DeFi protocols aims to connect traditional banking with decentralized finance ecosystems.