
Bitcoin Liquidation
Bitcoin Liquidation
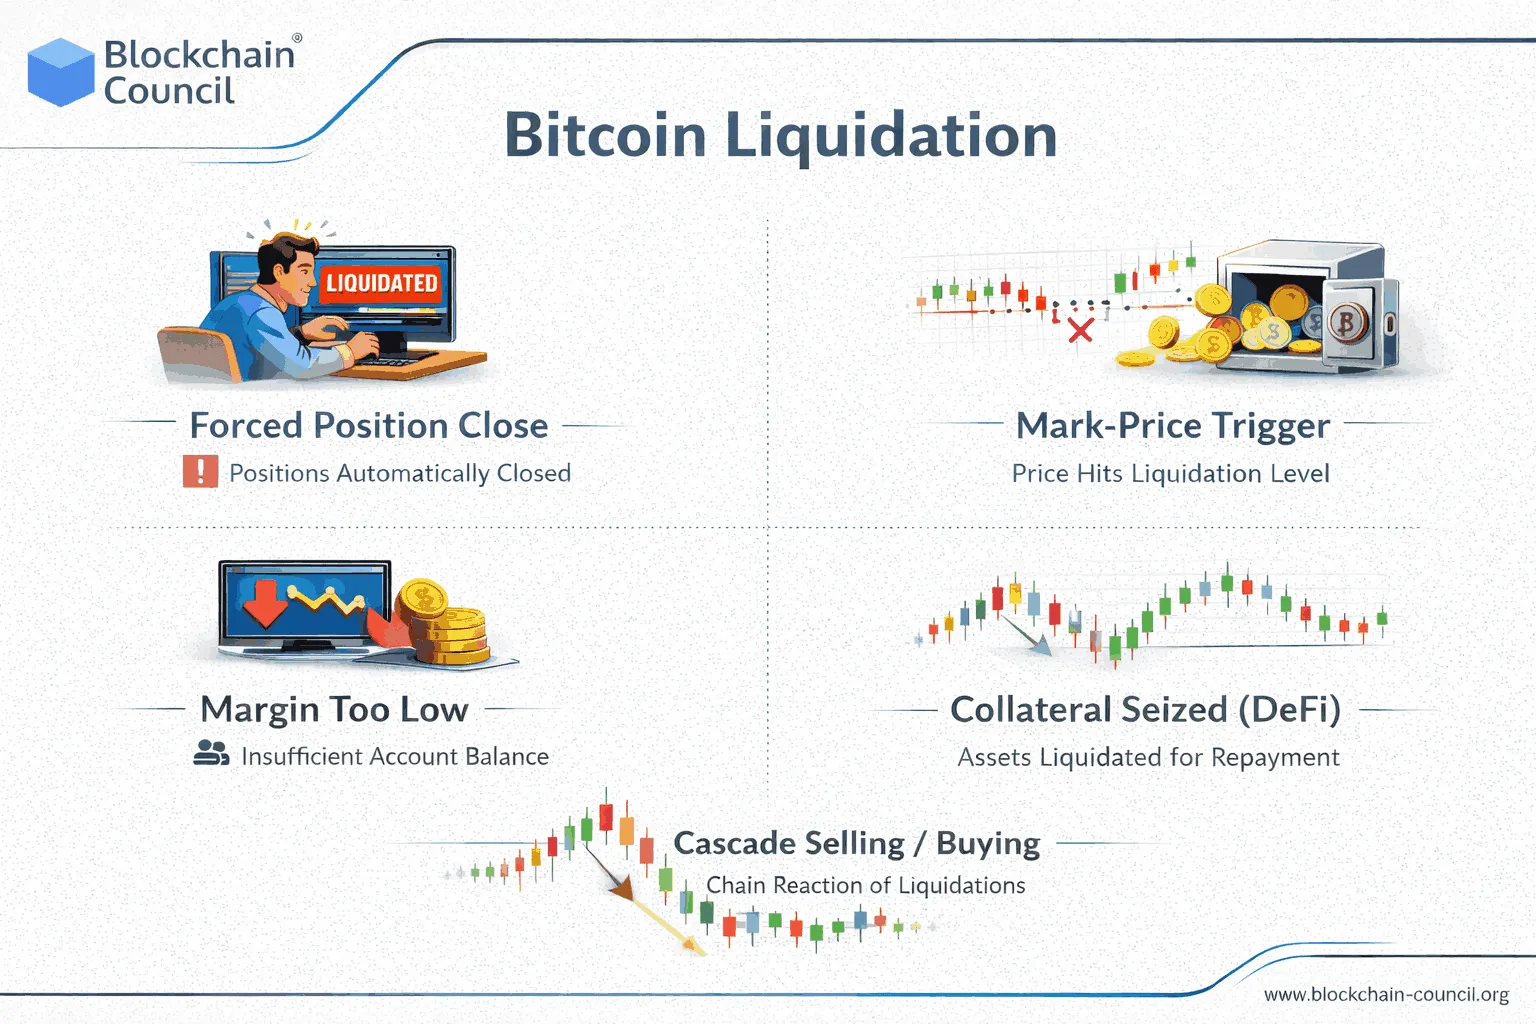
Bitcoin liquidation is a forced close. You open a BTC position using margin (or you borrow against BTC-like collateral), price moves against you, and your safety buffer gets too small. At that point the platform takes control and closes the position, sells collateral, or both. The goal is simple: stop losses from growing into a hole the platform can’t cover.
When people say “liquidation,” they usually mean one of two things:
- Exchange liquidation: a BTC futures or perpetual position is closed by the exchange when your margin falls below the minimum needed to keep it open.
- DeFi liquidation: a loan backed by BTC-like collateral becomes unsafe, so liquidators repay part of your debt and take collateral.
Both matter because forced orders can move price. That’s why traders track Bitcoin liquidations, watch a Bitcoin liquidation heatmap, and compare it with order-book tools like a Bitcoin liquidity heatmap and a Bitcoin liquidity chart. To know further, try a crypto couse to understand the basics.
Bitcoin Liquidation Meaning
A liquidation is not a normal exit. You don’t choose the timing or the fill. The engine closes you as soon as the account falls under its rules.
Here’s what liquidation looks like in practice on a margin exchange:
- You open a long or short using margin.
- BTC moves against you.
- Your unrealized loss grows.
- Your account equity for that position drops.
- Once equity is under the maintenance requirement, the system force-closes you.
And here’s what it looks like in a DeFi loan:
- You deposit collateral (often tokenized BTC).
- You borrow against it.
- BTC falls (or your debt grows via interest), so the collateral-to-debt ratio worsens.
- Once your account crosses the protocol’s safety line, liquidators can step in.
The word “liquidation” gets used for both, which is why headlines can feel confusing.
Exchange Liquidation
Exchange liquidation is mostly margin math. The exchange sets two key numbers:
- Initial margin: what you need to open the position.
- Maintenance margin: what you must keep to hold it open.
Once your equity falls under maintenance, the exchange closes the position.
A simple way to think about it:
- Margin is your buffer.
- Maintenance is the buffer floor.
- Liquidation happens when you hit the floor.
Maintenance Margin
Maintenance margin is not always one fixed percentage. Many venues use tiers. As your position size grows, the maintenance requirement can rise.
That matters because it can move your risk line closer than you expected:
- A larger position can push you into a higher tier.
- A higher tier means you must keep more equity.
- More required equity means less room for price swings.
If you scale up, check whether maintenance tiers change at your size.
Mark Price
A common surprise: many venues trigger liquidation using a reference price (often called mark price) rather than the last traded price.
Why it matters:
- Your chart can look fine on last price.
- The reference price can still touch your liquidation level.
- The engine closes you even if last price barely moved.
This also affects stops:
- If your stop is based on last price and sits close to liquidation, it may not trigger first.
- If liquidation triggers on the reference price, your position can be closed before your stop prints.
When traders complain about “getting taken out by a wick,” this is often part of the story.
Why Liquidation Price Moves
Liquidation price is usually shown as an estimate. It moves because the inputs move.
Common reasons your liquidation estimate changes:
- Maintenance tier changes as size increases.
- You add margin, which pushes liquidation farther away.
- You remove margin, which pulls liquidation closer.
- Fees and funding costs reduce equity over time.
- Your unrealized PnL changes each second.
If your liquidation line creeps toward price while BTC is flat, fees, funding, or a tier shift may be doing it.
Reason for Liquidation
The process is quick and mechanical. It often looks like this:
- Your margin ratio enters the danger zone.
- The system starts force-reducing or closing the position.
- In fast markets, fills can be worse than you planned.
This is where “Bitcoin liquidation wiped out” headlines come from. In a sharp move, positions can be closed in seconds, especially when many traders are using margin at the same time.
Backstops
Exchanges use backstops for times when closing liquidated positions in the open market would leave the venue with a loss.
Common backstops include:
- Insurance funds that absorb some losses.
- Forced position reductions in rare stress events (often called auto-deleveraging).
The takeaway is simple: liquidations are not always isolated. In extreme conditions, the venue may take actions to keep the system solvent.
Cascades
A liquidation cascade is a feedback loop where forced orders push price into more forced orders.
Long cascade:
- BTC drops.
- Longs hit liquidation levels.
- Forced sells push BTC lower.
- More longs hit liquidation.
- The loop repeats.
Short squeeze cascade:
- BTC jumps.
- Shorts hit liquidation levels.
- Forced buy-backs push BTC higher.
- More shorts hit liquidation.
- The loop repeats.
When you see Bitcoin short liquidations surge, it often means the squeeze loop is running. Forced buy-backs add demand on top of normal buying.
You’ll also see this described in headline language like Bitcoin price spike crypto shorts liquidation.
$X Liquidated
Most “$X liquidated” numbers come from tracking dashboards that estimate forced closes across exchanges.
What those numbers usually represent:
- Notional value of positions force-closed during a time window (often 1h, 4h, 24h).
- A split between long liquidations and short liquidations.
- Sometimes, a breakdown by exchange.
What they do not necessarily represent:
- Total trader losses (notional is not the same thing as loss).
- Full market coverage (it depends on which venues the tracker includes).
A large spike in Bitcoin liquidations often lines up with:
- A fast move in price.
- A sharp drop in open interest (positions removed).
- A funding shift (positioning changes).
Bitcoin Liquidation Heatmap
A Bitcoin liquidation heatmap is a model that estimates where clusters of margin positions may be forced closed if BTC trades into those prices.
You’ll also see the same search intent phrased as:
- Bitcoin liquidation heat map
- liquidation heatmap Bitcoin
What the chart is trying to show:
- Bright bands: areas where many liquidations are estimated to sit.
- Bands above price: spots where shorts may be forced to buy if price rises.
- Bands below price: spots where longs may be forced to sell if price falls.
How traders use it in a practical way:
- They mark the nearest bright bands above and below price.
- They assume reactions can be fast if BTC touches those zones.
- They treat the bands as “risk zones,” not guaranteed targets.
A heatmap can be useful, but don’t treat it like a map of where price must go. It’s a snapshot of where margin pain may be clustered.
Bitcoin Liquidation Map
A Bitcoin liquidation map is usually a broader view than a single heatmap panel. It often lets you change:
- Exchange filters
- Pairs (like BTC/USDT)
- Time window
- Display layers (clusters, ranges, or intensity)
In practice:
- A heatmap focuses on intensity bands.
- A map often adds structure and filtering so you can see where the risk is coming from.
If you’re scanning quickly, a map can help answer a simple question: is risk stacked on one venue, or spread across many?
How to Use Heatmaps?
Heatmaps are most useful when you combine them with basic context instead of staring at them alone.
A simple workflow:
- Check where price sits relative to the nearest hot bands.
- Ask whether the market is crowded on one side (funding, open interest, and recent liquidations).
- Check order-book depth near those areas.
Common mistakes:
- Placing stops inside a bright band because it “looks close.” Those areas often get swept.
- Assuming a band is a guarantee. It’s an estimate.
- Ignoring time and liquidity. A hot band during thin hours can hit harder.
Bitcoin Liquidity Heatmap
A Bitcoin liquidity heatmap usually refers to an order-book heatmap, not a liquidation model. It shows where limit orders are sitting over time.
What it answers:
- Where are large buy orders resting?
- Where are large sell orders resting?
- Is the book thick or thin around current price?
How it differs from a liquidation heatmap:
- Liquidity heatmap: resting orders that may absorb trades.
- Liquidation heatmap: estimated forced closes if price reaches certain levels.
They can point in the same direction, but they are not the same chart.
Bitcoin Liquidity And Bitcoin Liquidity Chart
Bitcoin liquidity is a broad term. Most people mean market liquidity: how easy it is to trade BTC without moving price too much.
A Bitcoin liquidity chart is often a depth chart. It shows cumulative buy and sell orders by price.
What to look for:
- Tight spreads and thick depth usually mean less slippage.
- Thin depth can mean quick moves and bad fills.
- Thin depth plus heavy margin positioning can make liquidations more violent.
If you trade with margin, depth matters because thin books can move the reference price faster, which can pull you into liquidation.
DeFi Liquidation
DeFi liquidation is tied to collateral safety, not a futures position.
Typical setup:
- You deposit collateral (often tokenized BTC).
- You borrow against it.
- If BTC falls, your collateral value drops.
- If your ratio breaks the protocol’s rules, liquidation becomes possible.
What liquidation usually means in DeFi:
- A liquidator repays part of your debt.
- The liquidator receives some of your collateral, often with a bonus.
- Your position becomes safer again (or it’s fully closed if it’s far under water).
If you use DeFi loans, treat your safety metric (often called health factor) like a gauge:
- Comfort zone: well above the danger line.
- Warning zone: drifting down toward the cutoff.
- Danger zone: close to liquidation.
Bitcoin Liquidity Pool
The phrase Bitcoin liquidity pool usually refers to DeFi pools used on automated market makers.
What a liquidity pool is:
- Crypto locked in a smart contract.
- Traders swap against the pool instead of an order book.
- Liquidity providers earn fees but take risks.
Why pool depth matters:
- Shallow pools can create high slippage.
- Deep pools can absorb larger swaps with less price impact.
Macro Liquidity And M2
Some searches use “liquidity” in a macro sense: money and credit conditions.
That’s the intent behind:
- Bitcoin global M2 money supply liquidity
- global liquidity vs Bitcoin chart
- global liquidity M2 vs Bitcoin price chart
What these overlays try to show:
- When broad money supply grows, risk assets often do better.
- When money supply growth slows or contracts, risk appetite can fade.
Two cautions that keep you honest:
- M2 is not the same as market liquidity in an order book.
- The relationship between M2 and BTC can change across time periods.
Use macro charts as context for the cycle, not as a short-term trading trigger.
Michael Saylor Bitcoin Liquidation Price
People search Michael Saylor Bitcoin liquidation price because they mix corporate debt risk with exchange liquidation.
A company can face a margin call on a specific loan if BTC drops enough, but that is not the same as a trader’s single liquidation line on a perpetual contract. Corporate debt can have:
- Different loans with different terms
- Different collateral rules
- Different ways to post more collateral
So when you see a claim that there is one clean “liquidation price” for a company, treat it as shorthand at best.
Reading A Liquidation Day
When you see a sudden spike in Bitcoin liquidations, don’t jump straight to “bullish” or “bearish.” Ask a few basic questions.
- Was it mostly long liquidations or short liquidations?
- Did open interest fall hard, suggesting positions were cleared?
- Did funding flip, suggesting traders changed sides?
- Did it happen during thin hours or around a headline?
Liquidations tell you forced positions were removed. They do not, by themselves, tell you the next move.
Tips
Liquidation is mostly a margin management problem, not a prediction contest.
If you want fewer surprises:
- Use smaller margin multipliers so normal BTC swings don’t put you on the edge.
- Keep real space between your stop and your liquidation estimate.
- Watch maintenance tiers if you scale size.
- Avoid thin hours if you can. Fast moves plus thin depth can mean ugly fills.
- In DeFi, add collateral or reduce debt early if your safety gauge is drifting down.
Bitcoin liquidation is simple once you separate the two types (exchange vs DeFi) and keep the charts straight (liquidation heatmaps vs order-book liquidity views). Do that, and you’ll read the next liquidation headline with a lot less noise.
To keep the learning streak on, check out expert curated tech certifications from the Global Tech Council. And for all your needs related business and marketing related courses from the Universal Business Council.