
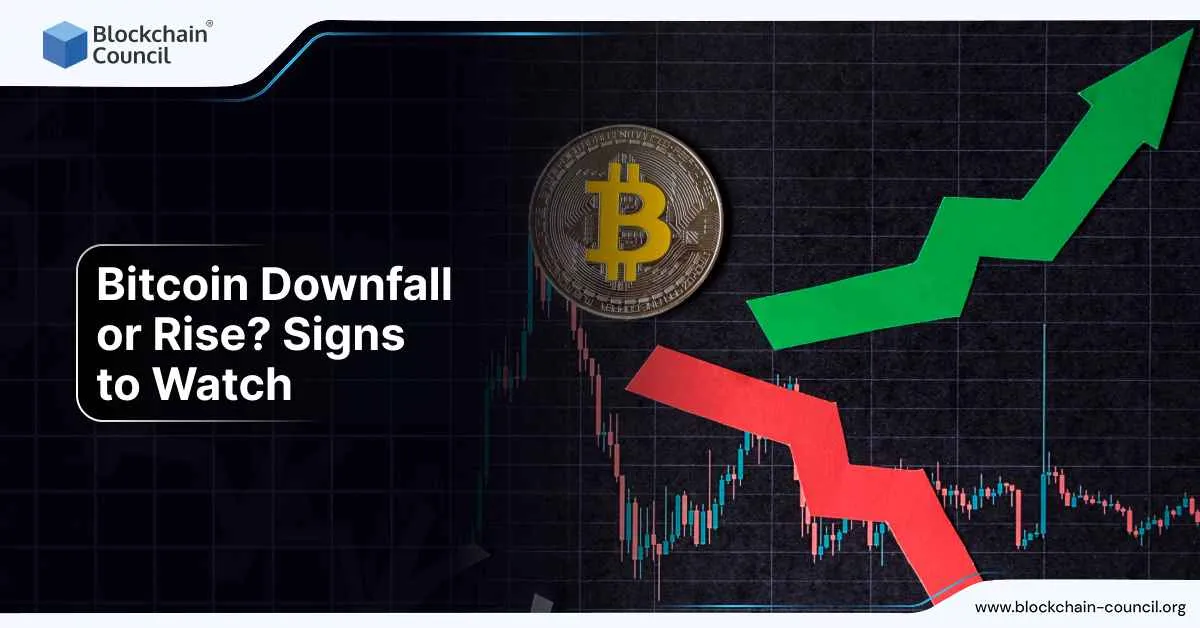
Bitcoin Downfall or Rise? Signs to Watch
Bitcoin is not giving you a polite, predictable trend right now. As of Feb 9, 2026, BTC is trading around $69,921, after last week’s sharp drop into the low-$60Ks and a fast rebound. A crypto certification helps here because “downfall or rise” is not a vibe-check, it’s a signals game.
Bitcoin price today
Bitcoin is a crypto asset in the crypto market.
Current price: $69,921.
Change vs previous close: -$683 (about -0.01%).
Intraday high: $72,024.
Intraday low: $69,496.
Those levels matter because the market is actively trading a wide range inside a single day, which is what unstable sentiment looks like.
Spot ETF flows
Spot ETF flows are now one of the cleanest real-time indicators of institutional risk appetite. When flows stay negative for multiple days, it often signals regulated capital is de-risking, not just crypto-native traders getting liquidated.
Recent coverage highlighted large outflows and sharp drawdowns in major spot Bitcoin ETFs during the Feb 5 selloff, and daily flow trackers showed big net outflow days around Feb 4 to Feb 5.
What to watch:
- Bullish: consecutive days of net inflows returning
- Bearish: persistent outflows even while price bounces, which increases “dead cat bounce” risk
Liquidations and leverage
Last week’s move had the classic leverage-flush pattern: price dumped, longs were forced out, and BTC rebounded toward the $70k area and consolidated.
That rebound is only constructive if leverage does not re-accumulate immediately.
What to watch:
- Bearish: another big liquidation wave on a relatively small dip, which implies leverage rebuilt too fast
- Bullish: cleaner moves with fewer forced liquidations, which usually means healthier positioning
Macro and risk markets
Bitcoin is still behaving like a high-beta risk asset. When broader risk stabilizes, BTC tends to bounce with it. Recent reporting tied the rebound to broader market stabilization, and framed the drop as part of a wider risk-off move plus leveraged liquidations.
What to watch:
- If equities roll over again, BTC often follows
- If equities stabilize but BTC cannot hold support, that is weak relative strength and usually bearish
Fear and sentiment
Sentiment indicators are deep in “Extreme Fear” territory right now, including single-digit readings on some trackers. Extreme fear is useful, but it is not a buy button.
Extreme fear can mean capitulation and a better recovery setup, or it can mean the trend is still down and fear is justified. Context decides.
What to watch:
- Extreme fear plus stabilization plus improving flows can be a decent recovery signal
- Extreme fear plus lower lows plus worsening flows usually means the downtrend is intact
Mining stress
Mining is under heavy profitability pressure, and the network recently saw a large difficulty reduction attributed to hashrate drops and storm-related curtailments. Mining stress can matter because it can add sell pressure when operators need liquidity, and it reflects broader economic conditions in the system.
What to watch:
- Neutral-to-bullish: hashrate recovering and difficulty expected to rise again
- Bearish: continued miner stress alongside falling price, which risks a negative feedback loop
Key price levels
People trade levels because humans love round numbers and shared reference points.
Recent coverage emphasized the psychological importance of $70,000. The prior panic zone sits in the low-$60Ks, which is the recent cycle-low area referenced in reporting.
What to watch:
- Bullish: holds above roughly $70k with improving flows and calmer leverage
- Bearish: loses roughly $70k again and slides toward prior lows while outflows persist
What this means for traders and holders
If you want “downfall or rise” in one line: the market is still deciding, and the decision is visible in flows, leverage, and whether $70k holds with support from risk conditions.
If you build tools or strategies around these signals, a Tech certification helps because interpreting flow data and liquidation dynamics is a systems problem, not a screenshot problem.
If you publish commentary or run a community, a Marketing certification helps because most people misread volatility unless you explain it plainly and consistently.
Conclusion
Bitcoin is not at a “done deal” moment. Price is around $69,921 with an intraday range from $69,496 to $72,024, which fits a market still jittery after a sharp selloff and rebound. If you want the clearest signs, watch spot ETF flows, whether leverage stays cleared, how BTC behaves relative to broader risk markets, whether extreme fear stabilizes or deepens, whether mining stress eases, and whether $70k turns into support or flips back into resistance.